FSSD Accessing Underlying Client Level Data
Click on the category bar for the data you want to examine further. A pop-up box will appear (Figure 8).
Three options are displayed along the top of the pop-up box: “Keep Only”, “Exclude”, and “View Data”.
Click “View Data” (Figure 8) to access underlying data for that bar.
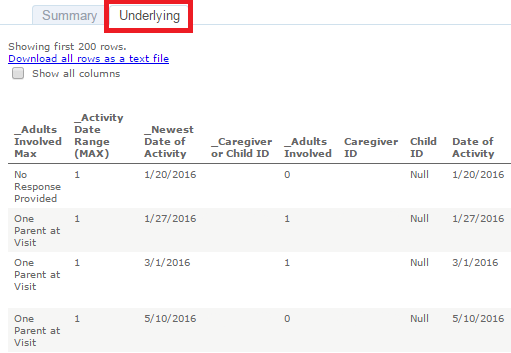
A new window opens with two tabs at the top: “Summary” and “Underlying”. Select the “Underlying” tab (Figure 9).
The data elements involved in creating that specific chart will be displayed. This should usually give you what you need to complete data clean-up or quality assurance work.
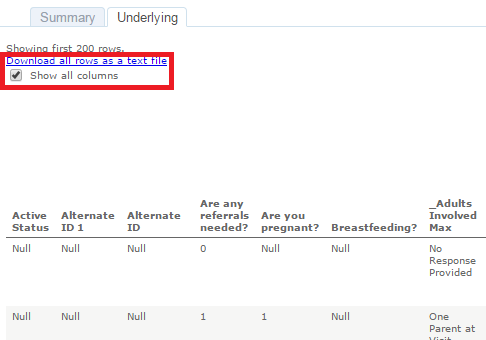
If you need to see the full data set, not just the data elements used to make the chart, click the checkbox next to “Show All Columns” (Figure 10). This data set can be downloading into an Excel document.


